Disclaimer: System names in this post have been changed to avoid disclosing confidential information. All numbers are accurate.
For the past two years, my team at Microsoft has been integrating Distributed Tracing (DT) into most of the critical microservices in Substrate, the platform that powers Microsoft 365. DT is the tool we reach for when an API misbehaves: it lets us pinpoint the exact node that produced the error, and surface the components that are dragging latency up.
DT pairs naturally with a system run by a partner team — Active Monitoring — a fleet of synthetic probes that continuously hit internal services and physical servers to make sure everything stays healthy. When a probe fails, a trace is the difference between “something is broken somewhere” and “this specific downstream call timed out on this specific machine.”
The scaling problem
Microsoft 365 runs on hundred thousands of physical servers spread across the globe. Active Monitoring alone generates roughly 78 million requests per hour at that scale. Every request that gets sampled produces a trace, and every trace carries dozens of spans across half a dozen services. The total volume was simply too large for our DT backend to ingest, store, and query at an acceptable cost.
So we needed to sample. The catch was the constraint Active Monitoring put on us:
If a synthetic request fails, we must have its trace. No exceptions.
Lose the trace and the alert is useless — on-call gets paged with no path to root cause. That’s worse than no alert at all.
The challenge, then, was not “reduce data.” It was: reduce data aggressively, but never drop an unhealthy request.
Why the off-the-shelf samplers didn’t fit
OpenTelemetry ships with two families of sampling strategies. We looked hard at both.
Head-based: Ratio Sampler
Head-based sampling decides whether to keep a trace at the moment it starts, before any spans have been recorded. The most common variant is the ratio sampler: keep N% of traces, drop the rest.
Pros:
- Cheap. The decision is local and instant.
- Predictable data volume. Pick 1%, you get 1%.
Cons (for our use case):
- It’s blind to outcome. An unhealthy request has the same chance of being kept as a healthy one.
- At global scale, the failure rate is tiny — a fraction of a percent. Any ratio low enough to fit our data budget would silently throw away most of the failures we exist to investigate.
Tail-based Sampler
Tail-based sampling makes the decision after the trace finishes, when the outcome is known. In theory it’s perfect: keep 100% of failed traces, drop 100% of successful ones.
In practice, it has two problems that turned out to be deal-breakers for us:
- You have to buffer every span of every trace until the decision is made. That buffer is itself an enormous storage and memory cost — you’ve moved the problem rather than solved it. At our volume, the “temporary” buffer would be larger than the backend we were trying to protect.
- You have to know where the trace ends. Tail-based sampling needs a “tail” — the last span — to trigger the decision. Microsoft 365 is a sprawling, constantly-evolving graph of services. There is no single canonical tail. Services get added, call graphs shift, async fan-outs make “the end” ambiguous. Any heuristic we picked would rot within a quarter.
The shape of a better answer: adaptive sampling
While digging through OpenTelemetry discussions and conference talks, I kept running into the term adaptive sampling — the idea that the sampler’s configuration itself should change over time in response to what the system is doing. There were hints, sketches, and one-paragraph descriptions, but nothing close to a battle-tested design we could lift.
So we designed our own. The core insight is small but powerful:
A head-based ratio sampler is fast and cheap. A tail-based sampler knows about outcomes. What if we kept the head-based sampler, but let outcomes from a few minutes ago drive its ratio?
We split the work between two new components:
AdaptiveSampleris our customized sampler, applied to Active Monitoring. It’s still head-based — the decision happens at the start of the trace, with no buffering. But instead of a single hard-coded ratio, it keeps a live per-server ratio map ([{serverA: 1.0}, {serverB: 0.1}, ...]) pushed in by the Config System. When a request lands on server X, it looks up X’s ratio and rolls a random number: SAMPLED with that probability, DROP otherwise.AdaptiveSamplerWorkeris the controller. Every 5 minutes it reads the last 5 minutes of Active Monitoring results from MDM, picks out any server that produced at least one unhealthy request (the hot servers), and writes a new ratio map to the Config System: 100% for hot servers, 10% for everyone else.
The Config System then propagates the map to every Active Monitoring server, where each AdaptiveSampler picks up the change and adjusts behavior on the next request.
The trade-off is a time lag. If a server fails for the first time at time T, we won’t sample it at 100% until the next worker tick computes the map and the Config System pushes it. The question becomes: how long is that lag, and is it acceptable?
Why this works at Microsoft 365: existing infrastructure
The lag question is where the design got lucky. Microsoft 365 already had two pieces of plumbing we could lean on:
Active Monitoring → MDM (our metrics store). Probe results land in MDM with a maximum latency of ~2 minutes.
Config System → every server. Configuration changes propagate to every server worldwide within ~5 minutes.
Stitching those together:
- An unhealthy request happens at time T.
- Its result is queryable in MDM by T + 2 min at the latest.
- The
AdaptiveSamplerWorkerreads MDM, computes new ratios, and writes the updated map into the Config System. - The new config arrives at the affected server by T + 7 min at the latest.
- That server stays at 100% sampling through the next decision window — until T + 12 min at the latest.
So in the worst case, a single failing request gives us a 5–10 minute window of full-fidelity tracing on the offending server, starting roughly 7 minutes after the failure. Long enough to capture the next failure if the issue is ongoing, which is the case that matters for on-call.
High-level design
Four components, one loop:

The only new components are the AdaptiveSampler (customized sampler, extending the OpenTelemetry base) and the AdaptiveSamplerWorker (Azure Function, triggered every 5 minutes). MDM, the Config System, and Active Monitoring itself were already in place and maintained by other teams. We didn’t build a sampling platform — we wrote a small custom sampler and a reactive controller that drives it.
A few notes on the controller that aren’t obvious from the diagram:
- Idempotent decisions. Each tick recomputes the full set of hot servers from scratch. There’s no incremental state to corrupt; if the worker crashes and restarts, the next tick is correct.
- Hysteresis-free, on purpose. A server that was hot at T and quiet at T+5 drops back to 10%. We considered a cooldown (“stay hot for two intervals after recovery”) and decided against it — the extra data wasn’t worth the added complexity, and 5 minutes of buffer at the next failure was already enough.
- Two ratios, not a curve. We tried a sliding scale (more failures → higher ratio) and abandoned it. Binary 100/10 is easier to reason about, easier to debug, and the data savings are dominated by the size of the quiet fleet, not by fine-tuning the noisy one.
Results
Once it was rolled out:
- ~99% reduction in healthy traces ingested by the DT backend.
- 0% reduction in unhealthy traces captured by Active Monitoring’s window.
In the Test ring, where unhealthy traffic is elevated by design, the savings were modest — there isn’t much healthy traffic for the sampler to drop:
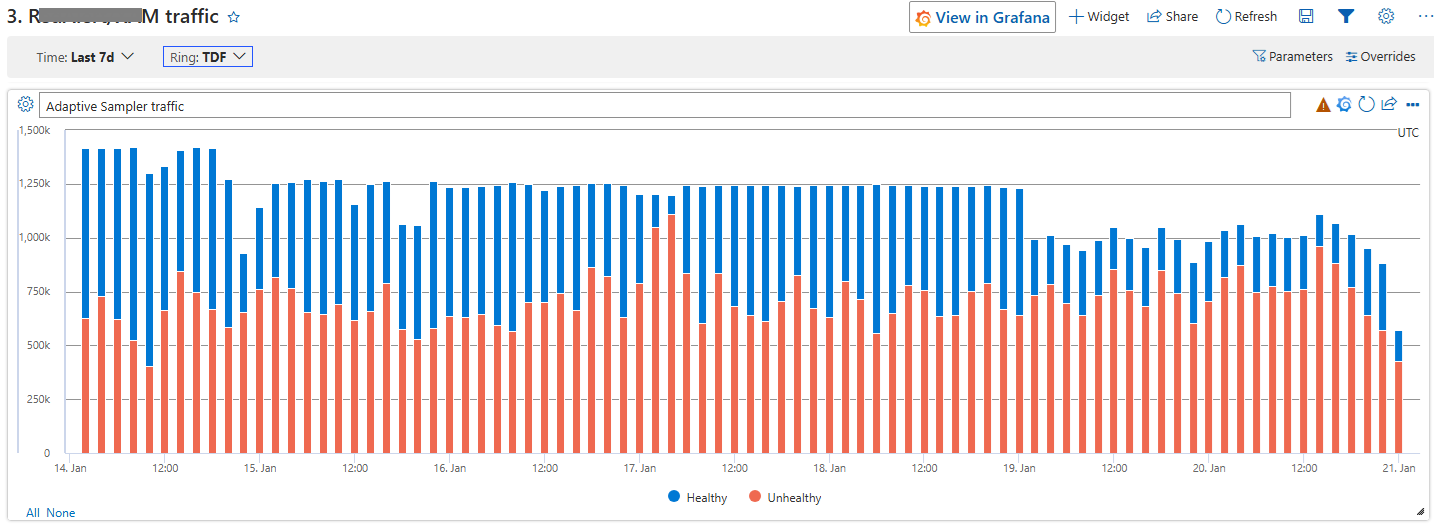 Test ring: healthy traces drop only modestly — most of the traffic is unhealthy by design, so there isn’t much for the sampler to throw away.
In the Global ring, where the fleet is overwhelmingly healthy, the drop is unmistakable. Look at where the rollout lands:
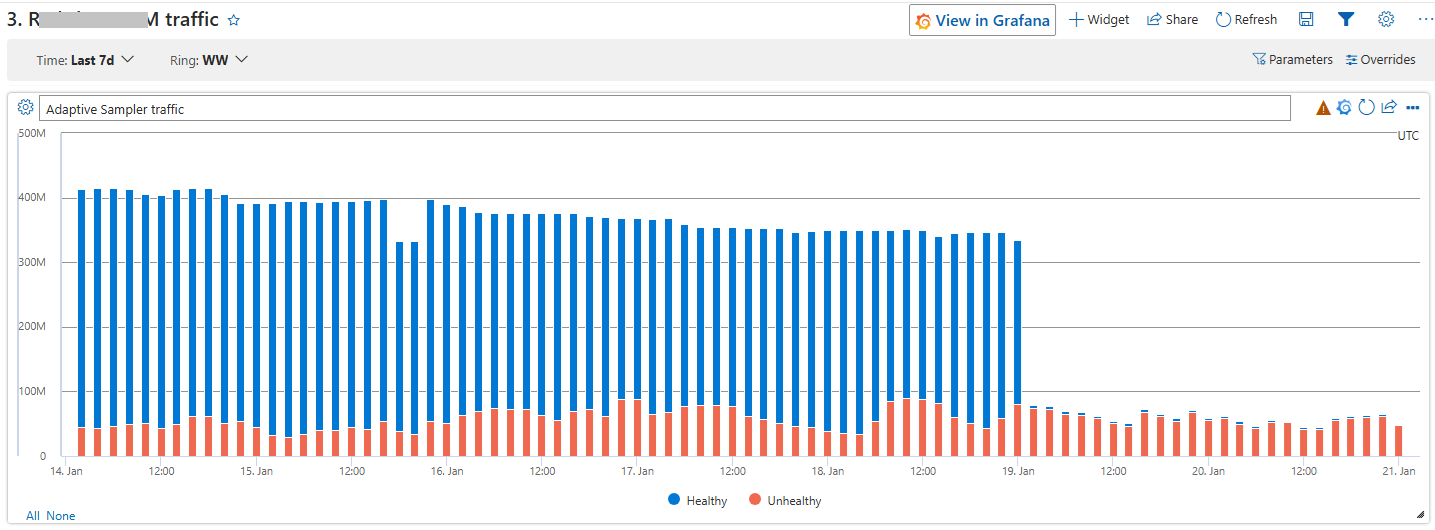 Global ring: healthy traces fall off a cliff the moment the AdaptiveSampler kicks in, while unhealthy traffic is almost unchanged.
Takeaways
A few things I’d pass along to anyone facing a similar problem:
- Don’t pick a sampler. Pick a control loop. Head-based vs. tail-based is a false dichotomy if you can move sampling configuration in minutes. The interesting design space is what signal drives the configuration change.
- Lean on the latency budget you already have. Our design only worked because MDM and the Config System were already fast. If they’d been hourly batch systems, this approach falls apart and you’re back to tail-based with all of its problems. Know your existing infrastructure’s clock before designing on top of it.
- “Lossy but in the right direction” beats “lossless but unaffordable.” We accept losing a single first-occurrence transient failure. We do not accept losing a sustained one. Defining the acceptable loss precisely was more useful than chasing zero loss.
- Adaptive sampling is underdocumented. The idea floats around in conference talks and OTel issues, but I couldn’t find a real-world write-up when we started. If you’re designing one, the answer is probably simpler than the literature makes it look — ours is fewer than a few hundred lines of worker code plus a SQL query against MDM.
If you’re staring at a DT bill that won’t fit your budget and a reliability requirement that won’t bend, this pattern is worth a look.